
Custom reports & Report Studio — dashboards of report widgets, choosing a subject, groupings, measures, and filters, then saving and exporting
Last updated: July 30, 2026 by Steve
Custom Reports & Report Studio
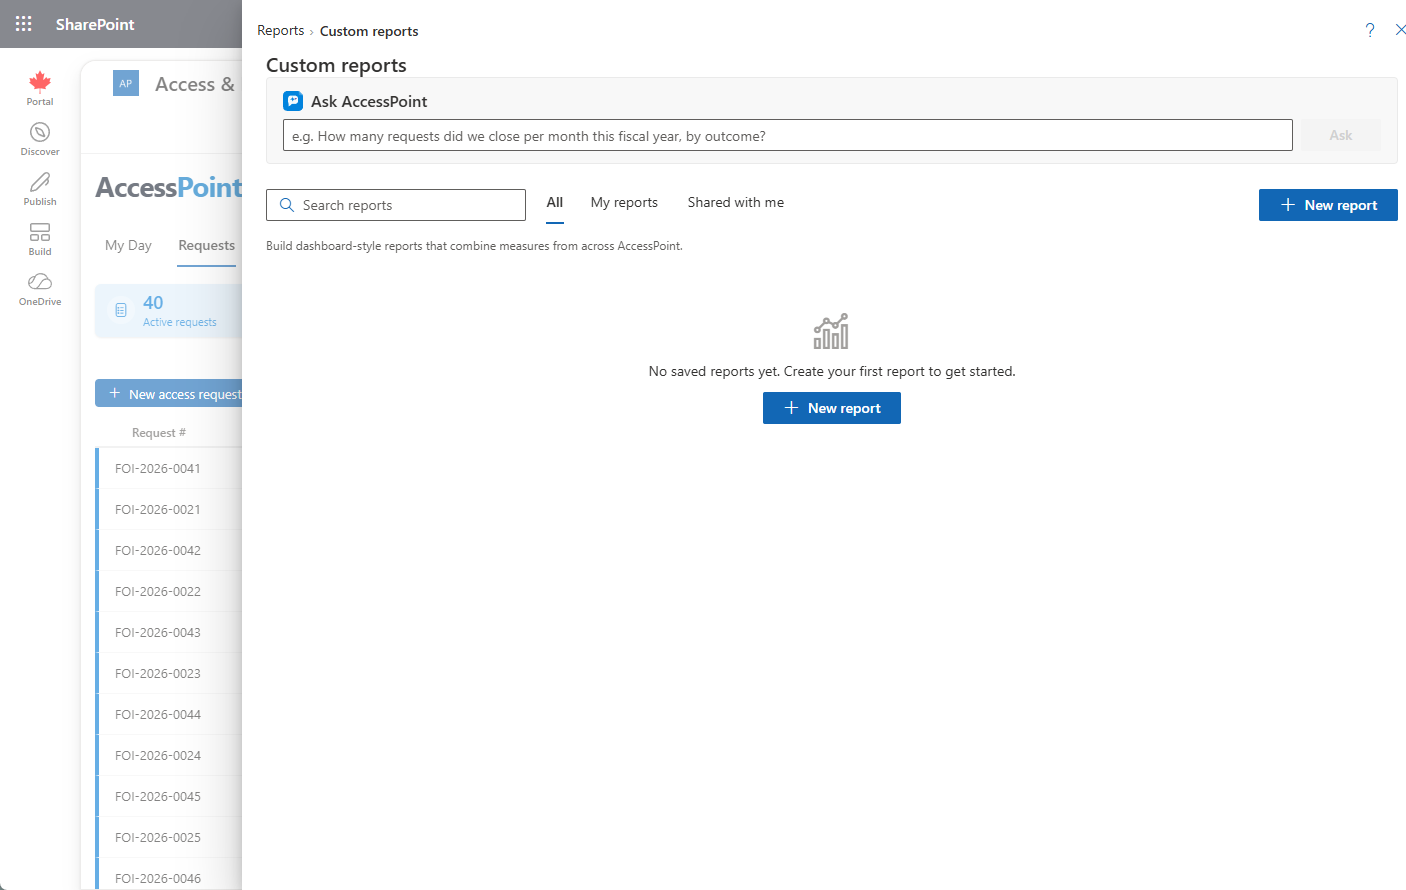
When a fixed report does not answer your question, the Custom group lets you build one from scratch — no SQL required. It opens on a custom-reports home listing your saved reports (and, when AI Assist is deployed, an Ask AccessPoint card — see below). Opening a saved report or starting a new one lands in Report Studio, the dashboard canvas: a dashboard is one or more report widgets arranged on a grid, each widget built with the report editor described below; a saved single-question report simply opens as a one-widget dashboard. A date bar across the top (defaulting to This Quarter, with the same quick-range presets as the fixed reports) applies one shared period to every widget at once, and you choose which widget's headline figures feed the report's pinned tile.
Building a Report
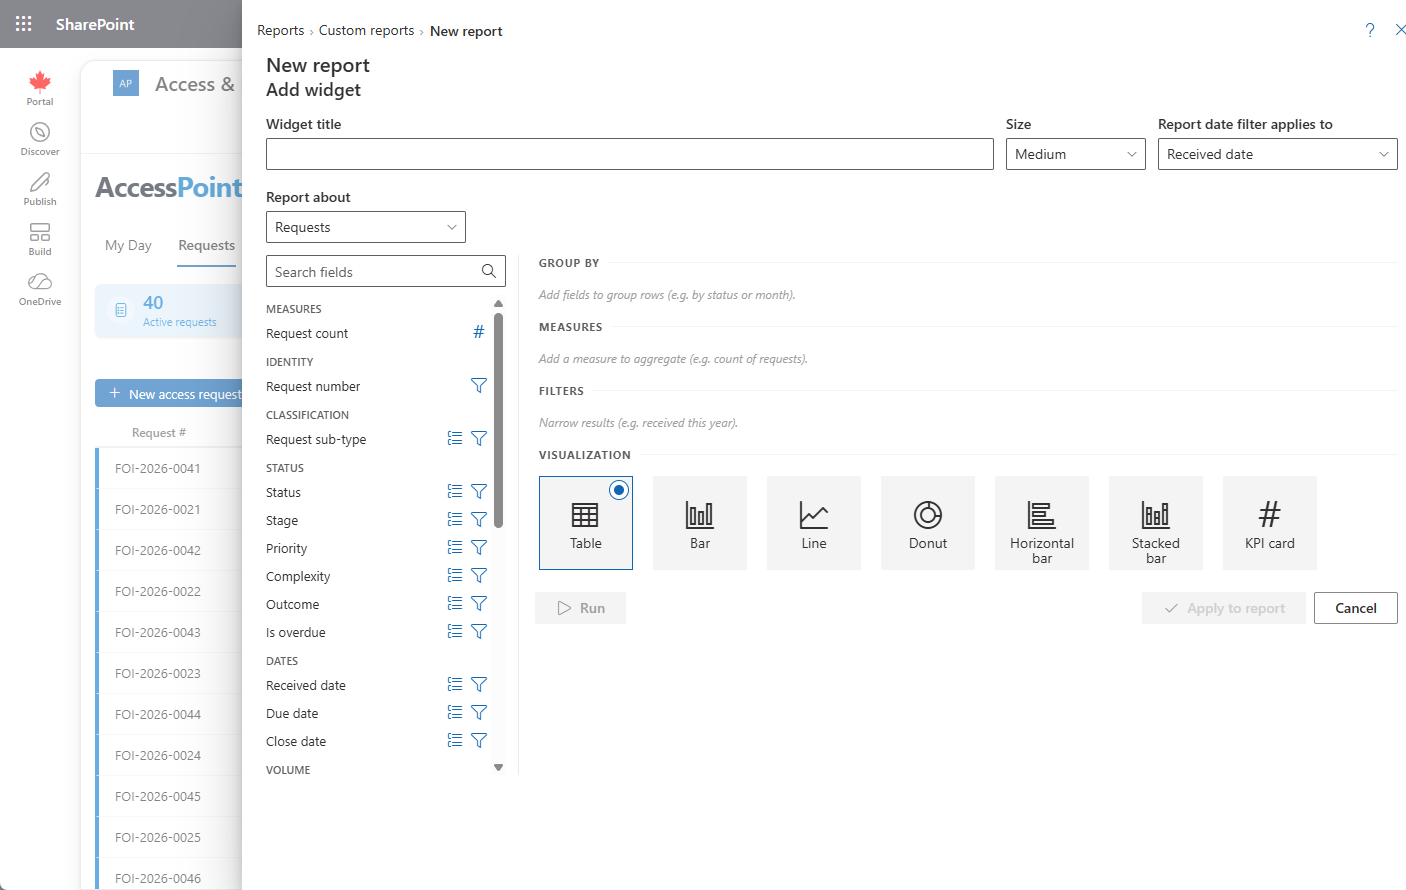
Each widget uses the same editor — a field catalogue on the left, configuration and preview on the right:
- Choose a subject in Report about (for example Requests or Consultations). The left-hand catalogue lists that subject's fields, grouped by category, with a search box.
- Group, measure, or filter each field using its inline icons:
- Group by a field to make it the rows of your report.
- Add a field as a Measure — a count, sum, average, minimum, or maximum.
- Add a field as a Filter. Fields that expose requestor personal information are flagged with a red eye icon.
- Configure each element — pick the aggregation for a measure, a date bucket (day, week, month, quarter, or year) for a date grouping, and an operator plus value for a filter. Date filters offer relative ranges such as This month or Last 90 days.
- Pick a visualization — Table, Bar, Line, or Pie.
- Click Run to preview. Large results are capped and flagged with a "showing the first N rows" notice — add filters to narrow the result.
- Click Export to Excel to download the full result.
When your report uses a single relative date filter with a named prior period (this month or this year), a Compare toggle appears and shows the previous period with per-measure deltas.
Ask AccessPoint
When AI Assist is enabled, you don't have to assemble every report by hand. Ask AccessPoint — on the custom-reports home and on My Day — lets you pose a reporting question in plain language, for example "how many requests did we close per month, by outcome?", and the AI builds a report definition against the same field catalogue the report editor uses. It never writes SQL, personal-information fields are never offered to it, and every result opens in Report Studio for you to refine, re-visualize, save, or export like any other report. Because the AI only ever produces a report definition, a wrong answer is a wrong chart, never a data leak.
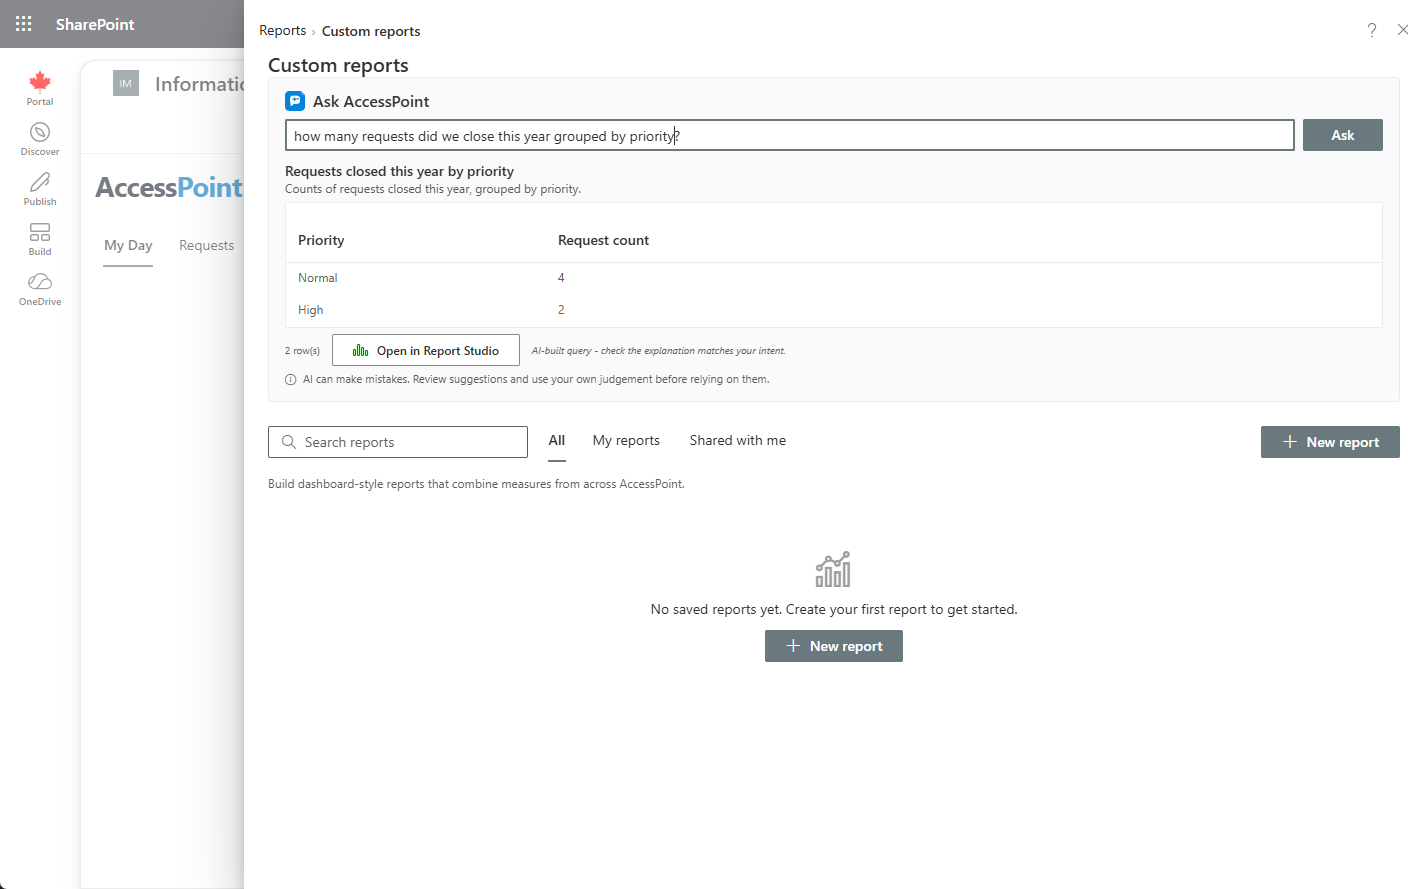
Ask AccessPoint is optional: it appears only where AI Assist has been deployed to your subscription and the feature is switched on under Settings → Features.
Saving and Sharing
- Click Save to name the report and optionally add a description.
- Toggle Share with everyone in the tenant to make it a shared report; otherwise it stays private to you.
- Saved reports are listed on the custom-reports home; shared ones are labelled "(shared)".
- You can update or Delete reports you own, and pin a saved report to My Day as a live tile.
Switching subjects intelligently keeps compatible selections — grouping Requests by complexity survives a switch to Consultations, for example — and Clear report starts fresh. Report definitions are stored language-neutrally, so a shared report reads correctly in every user's language.
Two subjects were widened in the 2.0.51 release — worth revisiting if you built reports against them before. Privacy risks now covers the whole register rather than only assessment-anchored risks (it previously omitted incident-anchored and standalone risks entirely, with no indication it was partial), and gained the posture fields — over appetite, residual likelihood/impact, target level, acceptance dates and expiry, realized-as-incident. Time entries now carries the case anchor, so hours logged against an assessment, incident, or complaint are attributable instead of arriving with a blank request.